
Whenever we analyze a Mutual Fund Scheme, returns play an important role in deciding which scheme to select. However, ‘Returns’ can be of various types such as Trailing Returns (or just Returns as we normally call it) and Rolling Returns.
What are Trailing Returns?
Trailing Returns also called as Point to Point Returns are Returns calculated between two specific dates.
Also Read – XIRR, CAGR & Absolute Returns – How different are they?
For Example: Returns of the Funds as shown in Table 1 are calculated between the 1st Oct 2012 and 30th Sep 2022. It measures the difference between NAV between these 2 dates. Let understand this –
Let’s calculate returns of HDFC Small Cap Fund
NAV of HDFC Small Cap Fund on 1st Oct 2012 – 14.895
NAV of HDFC Small Cap Fund on 30th Sep 2022 – 76.079
Point of Point Returns or Trailing Returns =
| Starting NAV | -14.895 |
| Period | 10 |
| Returns | 17.71% |
| Final NAV | 76.079 |
Calculated in excel using formula =Rate( )
Trailing returns gives us an idea of returns generated between these 2 dates.
Trailing Returns of HDFC Small Cap, Nippon India Small Cap and SBI Small Cap Fund are shown in the table below.
Table 1:
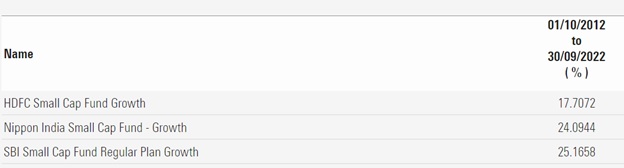
Source: Morningstar
What are Rolling Returns then?
Rolling Returns are calculated using Average of various periodic returns between two dates. While calculating Rolling Returns, we need to decide Frequency on which we wish to calculate the returns. This frequency can be Daily, Monthly, Quarterly or even Annually. In case of say, a monthly frequency returns between first and last date of the month is calculated. This is done for each date during period of 10 years. Average of these monthly returns over last year’s is Rolling Return.
As shown in the Table 2, Rolling Returns of HDFC Small Cap Fund are 22.5432% for 10 Years.
Similarly Rolling Returns of Nippon Small Cap Fund are 32.5357% and SBI Small Cap Fund are 30.6261%
Table 2:
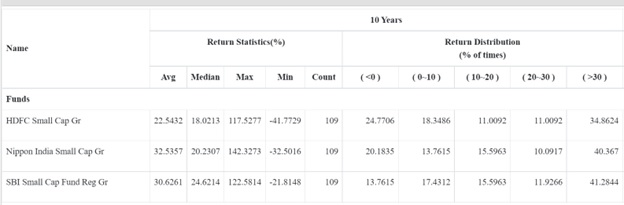
Source: Morningstar
Why Rolling Returns?
Point to Point Returns or Trailing Returns gives idea of the returns generated between two dates. This means if the NAV on the date of investment is at a low point and NAV at calculation date is at high point due to market volatility, the returns of that Fund will be seen superior.
The vice versa is also true. If the NAV on the date of investment is at high point and on the date of calculation NAV is at the low point, then the fund performance will be seen very poor.
But if you as an investor may not have invested on the same dates as discussed above. Hence your returns can be very different than the fund returns calculated as above.
Rolling Returns comes handy to solve this problem. Since you get an average of each period you get a fair idea of returns the fund is offering. Rolling Returns present a more holistic and accurate picture of the fund performance.
Moreover, few additional parameters can give some good insights.
Refer Table 2
Max Returns- Can you give you a fair idea of how fund manager could capitalize the rally in market. Nippon India Small Cap Fund has generated 142.32% returns during the best period which is better than the other funds.
Minimum Returns- Can give a fair idea of how the fund manager is protecting the downside. HDFC Small Cap Fund fell 41.77% during worst period. This fall is much higher than other funds. Fund manager could have avoided this.
% Times Returns less than 0% (negative Returns) – Can give you idea of how many times during this period the fund returns were below zero as compared the other funds. Again, HDFC Small Cap Fund (on a monthly rolling frequency as shown in table) has given Negative returns 24.77% of the time. This is much higher than other 2 funds. The other two funds have managed better than HDFC Small Cap Fund
Similarly other ranges like % of times returns between 0-10% or 10-20% or 20-30% can be used to compare similar parameter of other funds.
% Times Returns above 30% – Can give you idea of how many times Fund Manager could produce above 30% returns. SBI Small Cap Fund has produced above 30% returns 41.28% times.
Based on above insights we can decide which fund to invest in. As discussed earlier Rolling Returns gives a holistic picture of the fund performance and one can take an informed decision.
Conclusion:
When you try to judge performance of the fund based your investment dates, the performance may give you a fair idea about the fund. This is because the returns calculated while showing fund performance may be between different dates than that of date of your investment.
On the other hand, since Rolling Returns give average returns, you can get fair idea of how better the fund is managed.
Important – Financial Advisor in Nashik, Financial Advisor in Thane, Financial Advisor in Jalgaon, Financial Advisor in Pune